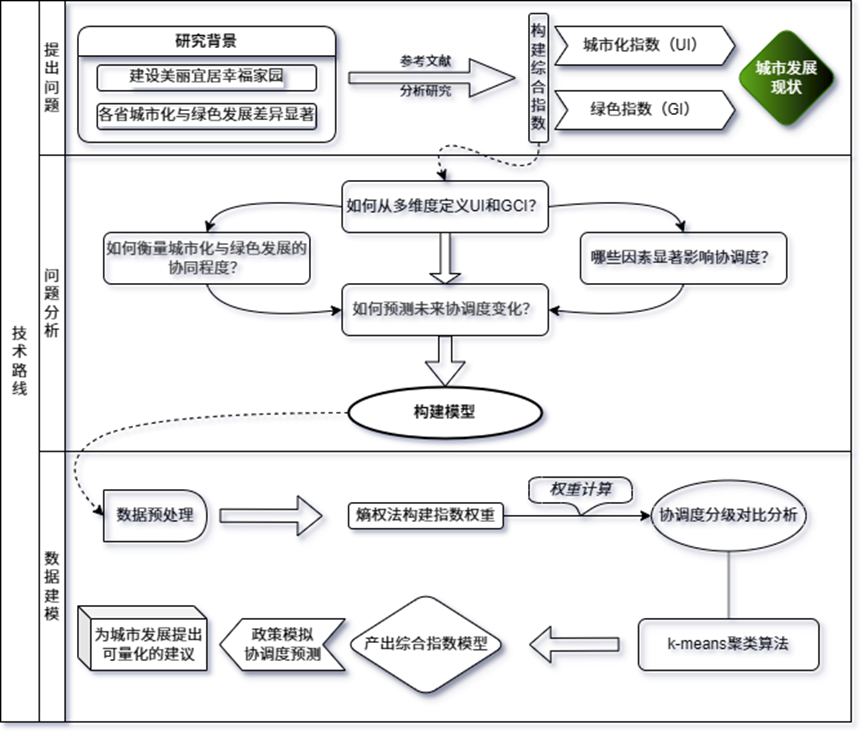
  1
  2
  3
  4
  5
  6
  7
  8
  9
 10
 11
 12
 13
 14
 15
 16
 17
 18
 19
 20
 21
 22
 23
 24
 25
 26
 27
 28
 29
 30
 31
 32
 33
 34
 35
 36
 37
 38
 39
 40
 41
 42
 43
 44
 45
 46
 47
 48
 49
 50
 51
 52
 53
 54
 55
 56
 57
 58
 59
 60
 61
 62
 63
 64
 65
 66
 67
 68
 69
 70
 71
 72
 73
 74
 75
 76
 77
 78
 79
 80
 81
 82
 83
 84
 85
 86
 87
 88
 89
 90
 91
 92
 93
 94
 95
 96
 97
 98
 99
100
101
102
103
104
105
106
107
108
109
110
111
112
113
114
115
116
117
118
119
120
121
122
123
124
125
126
127
128
129
130
131
132
133
134
135
136
137
138
139
140
141
142
143
144
145
146
147
148
149
150
151
152
153
154
155
156
157
158
159
160
161
162
163
164
165
166
167
168
169
170
171
172
173
174
175
176
177
178
179
180
181
182
183
184
185
186
187
188
189
190
191
192
193
194
195
196
197
198
|
# -*- coding: utf-8 -*-
import pandas as pd
import numpy as np
from sklearn.decomposition import PCA
from sklearn.cluster import KMeans
from sklearn.impute import SimpleImputer
from prophet import Prophet
import matplotlib.pyplot as plt
import os
import logging
plt.rcParams["font.sans-serif"] = ["SimHei"]  # 设置字体
plt.rcParams["axes.unicode_minus"] = False  # 正常显示负号

# ================== 配置参数 ==================
DATA_DIR = './province_data/'    # 原始数据存放目录
OUTPUT_DIR = './results_pca/'    # 结果输出目录
PROVINCES = [
    '河北', '山西', '辽宁', '吉林', '黑龙江', '江苏',
    '浙江', '安徽', '福建', '江西', '山东', '河南',
    '湖北', '湖南', '广东', '海南', '四川', '贵州',
    '云南', '陕西', '甘肃', '青海',
    '内蒙古', '广西', '西藏', '宁夏',
    '新疆'
]

# 配置日志
logging.basicConfig(level=logging.INFO, format='%(asctime)s - %(levelname)s - %(message)s')

# ================== 核心函数增强版 ==================
def robust_load_data(province):
    """修正版数据加载与预处理"""
    try:
        file_path = os.path.join(DATA_DIR, f"{province}.csv")

        # 加载数据并确保时间排序
        df = pd.read_csv(file_path, parse_dates=['时间'], encoding='utf-8')
        df = df.sort_values('时间')  # 确保时间有序

        # 列名标准化处理
        df.columns = [col.split(':')[0].strip().replace(' ', '') for col in df.columns]

        # 定义核心指标列
        required_cols = [
            '时间', '人口密度', '供水管道密度', '人均道路面积',
            '城市建设用地面积', '固定资产投资额', '污水处理率',
            '无害化处理率', '人均公园绿地面积', '绿化覆盖率', '污水再生率'
        ]
        existing_cols = [col for col in required_cols if col in df.columns]
        df = df[existing_cols]

        # 时间序列线性插值
        numeric_cols = [col for col in existing_cols if col != '时间']
        df[numeric_cols] = df[numeric_cols].interpolate(method='linear', limit_direction='both')

        # 处理剩余缺失值
        if df[numeric_cols].isna().sum().sum() > 0:
            imputer = SimpleImputer(strategy='mean')
            df[numeric_cols] = imputer.fit_transform(df[numeric_cols])
            logging.warning(f"{province} 使用均值填充剩余缺失值")

        return df
    except Exception as e:
        logging.error(f"加载 {province} 失败: {str(e)}")
        return None

def enhanced_entropy_weights(data, indicators):
    """增强型熵权法计算"""
    try:
        # 标准化处理
        normalized = (data[indicators] - data[indicators].min() + 1e-8) / \
                    (data[indicators].max() - data[indicators].min() + 1e-8)

        # 计算熵值
        p = normalized / (normalized.sum(axis=0) + 1e-8)
        entropy = (-1 / np.log(len(data))) * (p * np.log(p + 1e-8)).sum(axis=0)

        # 计算权重
        weights = (1 - entropy) / (1 - entropy).sum()
        return weights
    except Exception as e:
        logging.error(f"权重计算失败: {str(e)}")
        raise

def process_province(province):
    """增强版处理流程"""
    try:
        # 1. 加载数据
        df = robust_load_data(province)
        if df is None:
            return None

        # 2. PCA处理
        pca_cols = ['人口密度', '城市建设用地面积']
        if all(col in df.columns for col in pca_cols):
            pca = PCA(n_components=1)
            df['人口密度_PCA'] = pca.fit_transform(df[pca_cols])
        else:
            logging.warning(f"{province} 缺少PCA所需列")
            df['人口密度_PCA'] = df.get('人口密度', 0)  # 降级处理

        # 3. 定义指标体系
        ui_indicators = ['人口密度_PCA', '供水管道密度', '人均道路面积', '固定资产投资额']
        gci_indicators = ['污水处理率', '无害化处理率', '人均公园绿地面积', '绿化覆盖率']

        # 4. 计算权重
        ui_weights = enhanced_entropy_weights(df, ui_indicators)
        gci_weights = enhanced_entropy_weights(df, gci_indicators)

        # 5. 计算指数
        def safe_normalize(data, cols):
            return (data[cols] - data[cols].min()) / (data[cols].max() - data[cols].min() + 1e-8)

        df['UI'] = (safe_normalize(df, ui_indicators) * ui_weights).sum(axis=1)
        df['GCI'] = (safe_normalize(df, gci_indicators) * gci_weights).sum(axis=1)

        # 6. 保存结果
        os.makedirs(os.path.join(OUTPUT_DIR, "results"), exist_ok=True)
        output_path = os.path.join(OUTPUT_DIR, "results", f"{province}_结果.csv")
        df.to_csv(output_path, index=False, encoding='utf-8')
        logging.info(f"{province} 处理成功")
        plt.figure(figsize=(10,6))
        plt.plot(df['时间'], df['UI'], label='UI指数')
        plt.plot(df['时间'], df['GCI'], label='GCI指数')
        plt.title(f'{province}双指数发展趋势')
        plt.legend()
        plt.savefig(os.path.join(OUTPUT_DIR, f'{province}_趋势图.png'))
        return df

    except Exception as e:
        logging.error(f"处理 {province} 失败: {str(e)}")
        return None

def enhanced_cluster_analysis():
    """增强版聚类分析"""
    try:
        # 收集数据
        all_data = []
        for p in PROVINCES:
            result_file = os.path.join(OUTPUT_DIR, "results", f"{p}_结果.csv")
            if os.path.exists(result_file):
                df = pd.read_csv(result_file, parse_dates=['时间'])
                latest = df[df['时间'] == df['时间'].max()]
                latest['省份'] = p
                all_data.append(latest)

        if not all_data:
            raise ValueError("无有效数据可供分析")

        combined = pd.concat(all_data)

        # 检查数据质量
        if combined[['UI', 'GCI']].isna().sum().sum() > 0:
            combined = combined.fillna(combined.mean())

        # K-Means聚类
        kmeans = KMeans(n_clusters=4, random_state=42)
        combined['类别'] = kmeans.fit_predict(combined[['UI', 'GCI']])

        # 可视化
        plt.figure(figsize=(12, 8))
        scatter = plt.scatter(combined['UI'], combined['GCI'],
                            c=combined['类别'], cmap='tab10', s=100)
        plt.xlabel('城市化指数(UI)', fontsize=14)
        plt.ylabel('绿色城市指数(GCI)', fontsize=14)
        plt.title('各省份发展模式聚类分析', fontsize=16)
        plt.colorbar(scatter).set_label('类别', fontsize=12)

        # 标注省份名称
        for i, row in combined.iterrows():
            plt.text(row['UI']+0.01, row['GCI']+0.01, row['省份'],
                    fontsize=8, alpha=0.7)

        os.makedirs(os.path.join(OUTPUT_DIR, "plots"), exist_ok=True)
        plt.savefig(os.path.join(OUTPUT_DIR, 'plots', '全国聚类分析.png'), dpi=300, bbox_inches='tight')
        plt.close()

        # 保存结果
        combined.to_csv(os.path.join(OUTPUT_DIR, 'results', '全国分类结果.csv'),
                       index=False, encoding='utf-8')
        logging.info("聚类分析完成")

    except Exception as e:
        logging.error(f"聚类分析失败: {str(e)}")

# ================== 主程序 ==================
if __name__ == "__main__":
    # 初始化目录
    os.makedirs(OUTPUT_DIR, exist_ok=True)

    # 处理所有省份
    for province in PROVINCES:
        process_province(province)

    # 执行聚类分析
    enhanced_cluster_analysis()

    logging.info("===== 全部处理完成 =====")
    print(f"结果文件路径: {os.path.abspath(OUTPUT_DIR)}")
|
